Drug prevalence means “how many people use a drug in a set time.” Most Dutch surveys use three time windows: lifetime (ever), last 12 months, und last 30 days. These windows matter because “ever used” can stay high even if current use drops. In the Netherlands, national figures mainly come from the Leefstijlmonitor (CBS with partners like RIVM and Trimbos), which tracks changes year to year.
A simple way to express prevalence is:
Prevalence (%) = (Number of people who used the drug / Total people surveyed) × 100
Why trends change: price and purity, new pills or powders, nightlife culture, mental health, and policing all push use up or down. Trend data also shifts when a drug becomes “normal” in certain scenes (like clubs) or when health warnings spread fast through social media.
Quick guide to time windows (why they’re used):
Lifetime: shows “how common experimentation is.”
Last-year: best for “current” use and comparing groups.
Last-month: closer to “regular” use.
Amsterdam example: Big events (like festival weekends) can create short spikes in use that don’t always show up in “last-month” national averages. Hospitals in Amsterdam have reported emergency visits linked to party drugs during major Nachtleben moments like the Amsterdam Dance Event, showing how local patterns can differ from national ones.
Drug-specific statistics
A strong blog post separates drugs by type, because risks and patterns are very different. For example, cannabis is often used more regularly, while MDMA is more “episode-based” (used mainly during nights out). Cocaine tends to cluster around nightlife and higher spending, and opioids are more linked to dependence and overdose risk.
When you quote “statistics,” make it clear what is being measured: use, harms, or supply. For cocaine, Trimbos reports both lifetime and last-year use among adults in 2024 (for example: 7.4% ever and 2.4% in the last year). For MDMA and other stimulants, the European drug reports summarize patterns and harms across countries, which helps readers understand where the Netherlands fits in Europe.
Mini table: common “what to track” by drug
Drug
What the stats often show
Warum es wichtig ist
Cannabis
last-month use, age patterns
regular use affects school/work and driving
MDMA
last-year use, pill strength
“stronger than expected” raises overdose/heat risk
Cocaine
last-year use, adulterants
mixing agents can raise heart and anxiety risks
Opioids
treatment entry, overdoses
small dose errors can be deadly
Amsterdam example: Wastewater and monitoring studies show stimulants like MDMA and cocaine rise on weekends, which matches the city’s nightlife rhythm. That “weekend vs. weekday” gap helps explain why harms cluster around club nights.
Demographic breakdowns
A demographic breakdown answers: who uses what, and why. Drug use is rarely “even” across a country. Age matters the most: many drugs peak in young adults, then drop as people move into stable routines (jobs, families). Gender can matter too, often because of different social settings and risk-taking patterns.
A simple way to compare groups is a rate ratio:
Rate Ratio = Prevalence in Group A / Prevalence in Group B
Example: if last-year use is 6% in Group A and 3% in Group B, the ratio is 2.0, meaning Group A is twice as likely to report use. This helps readers understand differences without getting lost in raw numbers.
Useful demographic cuts to include (and what they explain):
Age (15–24, 25–34, 35+): shows life-stage effects.
Student vs. working: shows “party scene exposure.”
Urban vs. rural: shows availability and nightlife access.
Tourists vs. residents (city data): shows short-term, event-driven use.
Amsterdam example: During big party weeks, Amsterdam hospitals see many cases involving tourists as well as locals. That suggests some harms are linked to “one-time heavy use” by visitors who don’t know Dutch products, doses, or safe practices.
Quick checklist for EEAT-style clarity:
Always state the age range of the survey.
Say whether it’s self-report (survey) or objective (like wastewater).
Explain that groups may differ because of settings (clubs, festivals), not just “personal choices.”
Health and social impacts
Statistics on drug use should include impact, not only use. Impacts include emergency visits, treatment, infectious disease risks, und deaths. A key definition here is overdose: a toxic reaction when the body cannot safely handle the dose (or mixture) taken.
One helpful public-health equation is a population rate:
Death rate per 100,000 = (Number of deaths / Population) × 100,000
Europe-wide estimates show thousands of overdose deaths each year, but experts stress these totals are often underestimates because reporting systems differ by country. In the Netherlands, research discussions often highlight that opioids are involved in a large share of fatal overdoses, even if total deaths per capita are lower than in some other countries.
Why harms happen (step by step):
Unknown content (adulterants or stronger product than expected).
Wrong dose (especially after a break in use).
Mixing drugs (alcohol + stimulants + sedatives).
Delay in help (friends unsure what to do).
Amsterdam example: Party-related emergency presentations during events have included combinations like alcohol, MDMA, cannabis, and cocaine. This matters because mixing can hide warning signs until someone suddenly gets very sick.
Visual break: common harm metrics
ER visits linked to substances
Treatment admissions (first-time vs repeat)
Drug checking alerts (dangerous pills/powders)
Overdose deaths and toxicology findings
Policy and harm reduction outcomes
Dutch drug policy is often described as harm reduction focused: the goal is to reduce damage (deaths, disease, crime) even when drug use still exists. Harm reduction does not mean “drug use is safe.” It means: make the situation less deadly and connect people to care. Dutch harm reduction has a long history, including community-driven work that started in cities like Amsterdam.
A clear process to describe is drug checking, which reduces risk from unknown strength or unexpected ingredients. In Amsterdam, services like Jellinek and GGD Amsterdam let people test drugs anonymously and explain results and safer-use advice. Drug checking is also linked to broader monitoring systems that track what’s in circulation (like DIMS reports), which can trigger public warnings when dangerous trends appear.
Step-by-step: how drug checking lowers harm
Person submits a sample (pill/powder) anonymously.
On-the-spot screening or lab analysis checks contents/strength.
Staff explain results and safer choices (including “don’t use”).
Trends are monitored so alerts can be shared quickly.
Mini table: “policy lever” → “expected outcome”
Tool
What it tries to change
Why it works (in plain terms)
Drug checking
unknown strength/content
fewer surprises, fewer medical emergencies
Early warning alerts
risky batches in circulation
people avoid specific pills/powders
Low-threshold care
hard-to-reach users
easier to get help before crisis
Drug Use In The Netherlands
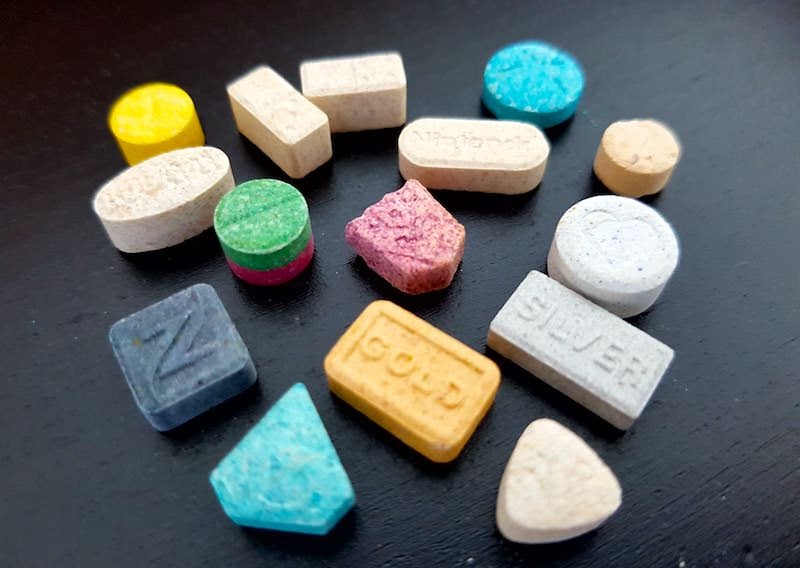
Ecstasy is the most popular entertainment drug among young adults. Alcohol and tobacco cause the most deaths from substance use. These are key takeaways from the Dutch National Drug Monitor 2018. The annual report of the National Drug Monitor (NDM) contains trends, figures and facts about the use of alcohol, tobacco and drugs. Various things stand out about drug use in the Netherlands in the report.
The full report on drug use in the Netherlands can be read here (Dutch, PDF).
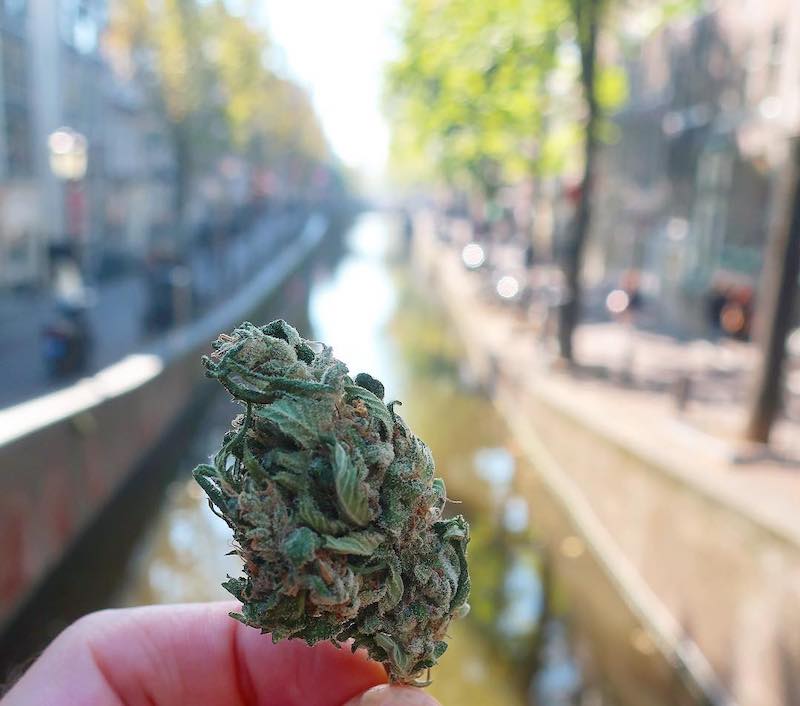
Almost 1 Million Cannabis Users In The Netherlands
In 2017, 960,000 adults in the Netherlands used cannabis in that year, the same number as in 2015 and 2016. That is around 7,2% of the total Dutch population aged 18 and older. Among young adults aged between 18-24, 2017 usage is the highest at around 25 percent.
THC Content In Dutch Cannabis Has Increased
The average level of THC in Dutch weed remained at the same level in 2018 as in 2017, seen over several years however, an increase can be observed. The most bought (popular) Dutch weed measured an increase from an average of 13,5 percent THC content in 2013 to an average of 16,8 percent in 2018; for weed that was purchased as the “strongest option”, the increase was on average from 15,3 percent in 2014 to 19,5 percent in 2018.
The highest THC content was measured in imported hashish (on average 23,5 percent), more than in previous years (14,9 percent in 2014). In contrast to Dutch weed, imported hashish also contains significant amounts of Cannabidiol (CBD), 8,5 Percent in 2018.
Average Price For Dutch Cannabis
The average price of one gram of the most popular Dutch weed (€ 10,09) did not differ from 2017 (€ 10,10) in 2018, but has risen since 2006; this also applies to the price per gram of the “strongest” weed.
Drug Use In The Netherlands: XTC
The increase in the percentage of ecstasy users between 2009 and 2015 appears to have stopped in 2016 and 2017. Nevertheless, the Netherlands remains a leader in Europe, followed at a distance by the United Kingdom (England and Wales). Use is highest among highly educated, young adults between 20-24 and in (very) urban areas. Ecstasy is still the most important party drug in the Netherlands. The percentage of students aged 12-16 who have experience with ecstasy decreased between 2015 and 2017.
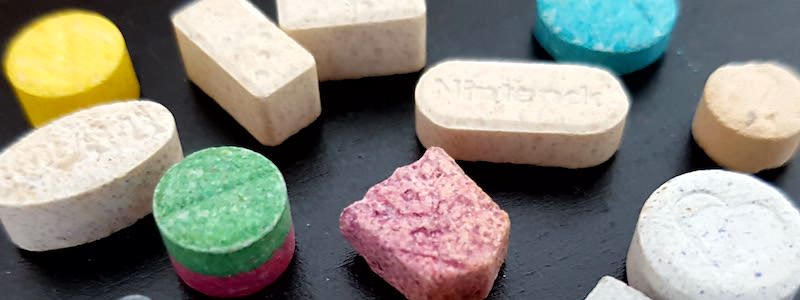
Ecstasy Continues To Increase In Strength In the Netherlands
In 2017, synthetic drugs were generally of high dose and not or less often mixed with other substances. In 2017, an ecstasy pill contained an average of 167 mg MDMA, again more than in previous years. Even nine out of ten pills had a high dose (> 106 mg MDMA).
Cocaine And Amphetamines in The Netherlands
The average percentage of cocaine in cocaine powders increased from 49 percent in 2011 to 68 percent in 2017. The price remains stable; since 2008 it has been an average of around 51 euros per gram. The content of amphetamine in speed powders is stable at an average of 42 percent.
Drug Use In The Netherlands: Ketamine
Ketamine appears to gaining in popularity in the Netherlands. The number ketamine samples that were submitted to the DIMS in 2017 increased. Since 2009 the proportion of registered drug incidents on first aid that involves ketamine has also risen sharply: from 2,9% in 2009 to 8,2% in 2017.
The percentage of last-year users is many times higher among frequent partygoers than in general adult population, although the drug is not really a ‘typical’ party drug.
GHB Relatively Often Leads To Health Incidents
The use of the anesthetic agent GHB is relatively rare nationally and in the general Dutch population. In 2017, 0,4 percent of adults (around 50,000 people) had used GHB in the past year; that is less than ecstasy (2,7 percent), cocaine (1,8 percent), and amphetamine (1,4 percent). However, the number of health incidents with GHB is relatively high and often of serious nature.
Alcohol And Tobacco Use in the Netherlands
The number of smokers in the Netherlands is declining. The decrease is smaller among people with a low level of education than among people with a medium or high level of education. The number of excessive drinkers stayed stable.
In contrast to smoking, it’s precisely the higher educated who drink more frequently (9,9 % of adults) compared to people with a low level of education (8,7 %). There are an estimated 1,800 deaths due to alcohol consumption in the Netherlands (Quelle).
These are largely attributable to strokes, cancer, diseases of the digestive organs and mental disorders. The estimate takes into account the protective effect of light alcohol consumption on some diseases and mortality. For smoking, the estimated total related number of deaths is 19,500 (Quelle).
1) What are the most-used drugs in the Netherlands?
Cannabis is the most commonly used drug. After that, national surveys often track stimulants like MDMA (ecstasy) und cocaine because they are common in nightlife. The exact ranking can vary by age group and city.
2) How many adults in the Netherlands used drugs in the last year?
A recent Dutch overview reports that about 1 in 10 adults (18+) used at least one drug in 2024 (within the last 12 months). This “last-year” measure is useful because it reflects current use, not just experimentation long ago.
3) What does “lifetime,” “last-year,” and “last-month” use mean?
These are standard time windows in drug statistics:
Lifetime use: used at least once ever
Last-year use: used at least once in the past 12 months
Last-month use: used at least once in the past 30 days
They matter because lifetime use can stay high even if current use drops.
4) Why do Dutch surveys and reports sometimes show different numbers?
Because they may differ in:
Age range (e.g., 18+ vs 15–34)
Definitions (what counts as “drug use”)
Methods (survey answers vs wastewater monitoring)
Year of data collection
Always check the Quelle, year, und time window before comparing.
5) Is drug use higher in Amsterdam than the national average?
Often, big cities show different patterns because of nightlife, events, and tourism. But “higher” depends on which drug und which measure (last-month vs last-year). For city-level proof, look for municipal health (GGD) reports or wastewater studies.
6) What is “harm reduction,” and why is it used in the Netherlands?
Harm reduction means lowering health damage (like overdoses and infections) even when drug use still happens. It focuses on practical steps: safer-use info, early warnings, and easier access to care. Dutch programs are often cited as long-running examples of this approach.
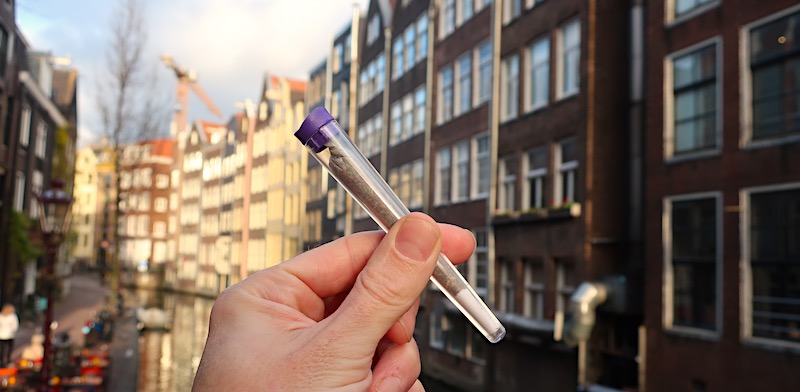
7) Can you get drugs tested in Amsterdam?
Yes. Drug testing is available through services like GGD Amsterdam und Jellinek, where people can test drugs anonymously and get information about contents and strength. This helps reduce harm from unexpected ingredients or very strong pills.
8) What is DIMS, and why does it matter for statistics?
DIMS (Drug Information and Monitoring System) monitors what substances show up in tested samples and tracks trends. It helps create warnings when dangerous batches appear and supports public-health reporting beyond surveys.
9) Why are stimulants (MDMA/cocaine) such a focus in Dutch drug stats?
Because they are strongly linked to nightlife settings and can cause medical emergencies—especially when mixed with alcohol or other drugs. European monitoring reports highlight that MDMA-related emergency cases often involve multiple substances.
10) What is the safest way to interpret drug statistics as a reader?
Use this quick checklist:
Find the source (CBS/Trimbos/RIVM/EUDA are strong)
Check the year und age group
Note the time window (lifetime vs last-year vs last-month)
Look for trend lines, not one-year jumps
Pair use rates with harm data (treatment, ER visits, warnings)
This prevents bad comparisons and gives a clearer picture of real risk.
Martijn hat in den vergangenen Jahren Hunderte Touren durch das Rotlichtviertel und De Wallen in Amsterdam geführt. Er schreibt aus erster Hand — die Shows, die er gesehen hat, die Bars, die er kennt, und die Straßen, durch die er jede Woche geht — und seine Touren und Fotos sind auch auf TripAdvisor zu finden. Alles hier wird mit dem abgeglichen, was er und unsere lokalen Guides vor Ort sehen.
Erfahrung: jahrelange persönliche Erfahrung mit Touren durch das Rotlichtviertel & De Wallen
Standards: aus erster Hand, vor Ort geprüft, nützlich für echte Besucher
Transparenz: einige Links sind Affiliate-Links (ohne Mehrkosten für Sie)


Are recreational drugs such as ecstasy or methamphetamine legal in the Netherlands or is purchase/use legally confined to Amsterdam/designated areas?