Amsterdam Nightlife Economy Statistics 2026: Spending, Jobs & Late-Night Tourism
Posted on: maart 1, 2026
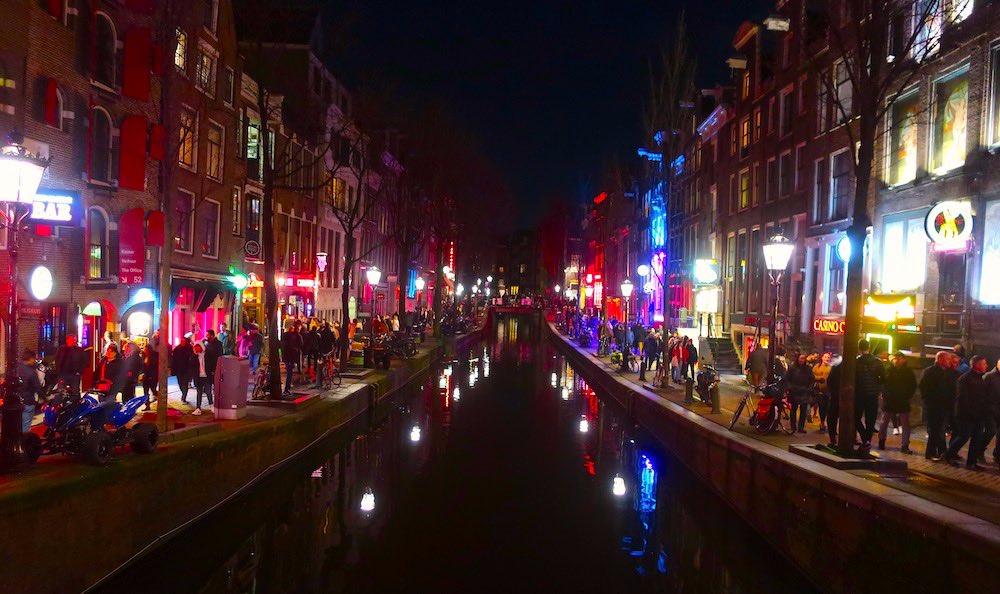
Amsterdam’s nightlife is more than bars and canals—it’s a multi-billion-euro economic engine. This page breaks down the latest data from 2025–2026 about how nightlife affects spending, jobs, and city costs—especially in and around the Red Light District.
This resource is built for journalists, researchers, and travel writers who need updated and verifiable data. You’ll find original sources, clear formatting, and pre-made charts you can use in your own content.
Geschreven door Mariska Majoor, ex-prostituee, oprichtster van het Prostitutie Informatie Centrum en Amsterdams bekendste sekswerkersactiviste. Deze vrouw werd zelfs geridderd door het Nederlandse koningshuis. Mariska is zonder twijfel een van de meest deskundige experts op het gebied van prostitutie in Nederland. Ze is al meer dan 30 jaar actief in deze sector. Martijn (Amsterdam-based researcher).
Important note for journalists: Amsterdam does not publish one official “nightlife GDP” number for 2026. This page uses the best publicly available city + national sources, plus clearly labeled estimates from published research.
Key Nightlife Economy Statistics
Here are the most citable nightlife-economy facts for Amsterdam (latest public sources available as of 2025/2026):
- €1.25 billion — Atlas Research estimates visitors who come to Amsterdam for “fun and going out” spend about €1.25B during their stay. (Atlas Research)
- 541 night venues and 5,000+ jobs — the same study counts 541 “nachtvenues” and says they support over 5,000 jobs. (Atlas Research)
- €63 million — Atlas Research estimates about €63M in annual local welfare gain (business profit component) from that “fun and going out” visitor spending. (Atlas Research)
- 23.0–24.6 million — Amsterdam’s research office forecasts 23.0–24.6M tourist overnight stays in 2025 (with growth expected after). (Onderzoek Amsterdam)
- 600,000 — Amsterdam Dance Event (ADE) reports a record 600,000 visitors in 2025, with 1,200+ eventsacross 300+ locations. (amsterdam-dance-event.nl)
Quick definitions:
- Night economy: spending + jobs linked to late-night activity (hospitality, events, transport, safety, cleaning).
- Welfare gain (welvaartswinst): not total revenue; it’s the extra local value after costs, often modeled as profits + tax effects. (Atlas Research)
Visual break: “2026 snapshot” citation-ready lines:
- “Atlas Research estimates ‘fun and going out’ visitors spend €1.25B during their Amsterdam stay.” (Atlas Research)
- “Amsterdam’s Nachtvisie cites 541 night venues supporting 5,000+ jobs.” (Amsterdam.nl)
- “ADE 2025 welcomed 600,000 visitors across 1,200+ events op 300+ locations.” (amsterdam-dance-event.nl)
Tourist Spend After Dark (estimates + methodology)
No public dataset says “the average tourist spends €X on nightlife” for Amsterdam. What we do have is a defensible way to estimate after-dark spend using published inputs.
Atlas Research publishes the building blocks it used to estimate nightlife-related visitor value. For 2019 (the last pre-COVID baseline used in the report), it reports:
- Day visitors: average spend €78.58 per person during their stay. (Atlas Research)
- Overnight visitors: average spend €170.30 per person per day (including the overnight component). (Atlas Research)
- It then shows how these inputs can roll up into the €1.25B “fun and going out” spend estimate. (Atlas Research)
Methodology box (journalist-friendly)
Goal: estimate the share of visitor spending that plausibly happens “after dark” (evening + night).
Core equation (simple):
After-dark spend = Total visitor spend × After-dark share
Where:
- Total visitor spend can be taken from a published estimate like €1.25B (“fun and going out” visitors). (Atlas Research)
- After-dark share must be justified with a transparent rule, for example:
- define “after dark” hours (e.g., 18:00–06:00),
- map likely spending categories (bars, clubs, late transport),
- test sensitivity (e.g., 25% / 35% / 45%) and report a range.
Why this is honest: you are not inventing a single magic number. You are showing your inputs and how the estimate changes.
Visual break: What you can cite vs. what you should label as an estimate
| Item | Safe to cite as fact? | Notes |
|---|---|---|
| €1.25B “fun & going out” spend | ✅ | Published estimate by Atlas / referenced by the city (Atlas Research) |
| €78.58 day visitor spend | ✅ | Published in Atlas methodology (Atlas Research) |
| “After-dark share = 35%” | ❌ | Only valid if you justify it as your assumption |
Hospitality Jobs & Business Counts
The cleanest “nightlife jobs” figure in public sources comes from Amsterdam’s Nachtvisie, which summarizes research done for the city.
The Nachtvisie states that Amsterdam’s night culture is linked to about 5,000 jobs, and it connects that to a counted base of 541 night venues / night locations. (Amsterdam.nl)
That matters because “nightlife” is not one industry code in official statistics. It sits across bars, clubs, venues, events, taxis, and security.
The hospitality industry is where people come together, have fun, and just let go. I’m at the heart of that nightlife every week and know how important those moments are. I’m proud to fulfill this role and represent Dutch nightlife.
For broader context (useful when writing about the visitor economy around nightlife), CBS reports that total tourist spending in the Netherlands was €111.2B in 2024 (domestic + international). (Centraal Bureau voor de Statistiek)
This doesn’t equal “Amsterdam nightlife,” but it helps explain why late-night sectors (food, drink, transport, events) matter economically.
How to quote this safely (two options):
- Narrow / nightlife-specific: “Amsterdam’s Nachtvisie cites 541 night venues supporting 5,000+ jobs.” (Amsterdam.nl)
- Wide / visitor economy: “CBS reports €111.2B in tourist spending in the Netherlands in 2024.” (Centraal Bureau voor de Statistiek)
Visual break: Citation-ready lines
- “Nachtvisie Amsterdam links night culture to ~5,000 jobs en 541 night locations.” (Amsterdam.nl)
- “CBS: tourist spending in the Netherlands was €111.2B in 2024.” (Centraal Bureau voor de Statistiek)
City Costs (cleaning, policing, public order)
Amsterdam does publish budgets for safety en cleaning, but it usually does not split them into “nightlife zone only” costs in one neat line item. What you can cite is the scale of city spending in the programs that cover nightlife impacts.
From the municipality’s Najaarsnota 2025:
- Program 8 (Safety / Veiligheid): €328.6M in expenses (lasten) in 2025. (Amsterdam.nl)
- Within that, “Public order and safety” (Openbare orde en veiligheid) shows €227.5M in expenses (lasten) in 2025. (Amsterdam.nl)
For cleaning and the public realm:
- Program 2 (Open public space): €311.7M in expenses (lasten) in 2025. (Amsterdam.nl)
- Inside that, “Waste & cleaning public space” shows €273.7M in expenses (lasten) in 2025. (Amsterdam.nl)
How to explain “nightlife costs” without guessing
Use this 3-step framing:
- Nightlife concentrates demand (crowds, transport, cleaning, enforcement).
- The city pays through the programs above (safety + cleaning). (Amsterdam.nl)
- If you need a nightlife-only figure, request it via FOI/municipal data or cite a dedicated study—don’t invent one.
Visual break: Simple table for journalists
| Cost area | Where it sits in city docs | 2025 expenses (lasten) |
|---|---|---|
| Safety (total) | Program 8 Veiligheid | €328.6M (Amsterdam.nl) |
| Public order & safety | 2.8.2 Openbare orde en veiligheid | €227.5M (Amsterdam.nl) |
| Public space (total) | Program 2 Openbare Ruimte | €311.7M (Amsterdam.nl) |
| Waste & cleaning | Afval & Reinigen Openbare Ruimte | €273.7M (Amsterdam.nl) |
Trends (peak months, major events)
For “nightlife demand,” the most citable trend signals are overnight stays en major events that pull people into the city at night.
Amsterdam’s research office forecasts 23.0–24.6 million tourist overnight stays in 2025. (Onderzoek Amsterdam)
That matters for nightlife because overnight visitors are more likely to be out late (they don’t need to catch the last train home).
The same office notes that in 2024 there were nearly 23 million overnight stays, and it also gives helpful context like visitor volumes and how stays are changing. (Onderzoek Amsterdam)
This is useful when you’re writing “late-night tourism pressure” stories.
For event-driven nightlife spikes, ADE is the clearest “major event” marker:
- ADE 2025: 600,000 visitors, 1,200+ events, 300+ locations. (amsterdam-dance-event.nl)
If you want a “behavior shift” angle, an industry analysis (Bolt ride data reported via TaxiPro) claims Amsterdam nightlife has shifted earlier based on millions of night rides between 20:00–06:00. Treat this as industry analysis, not official statistics. (TaxiPro)
Visual break: Trend bullets you can quote
- “Amsterdam forecasts 23.0–24.6M tourist overnight stays in 2025.” (Onderzoek Amsterdam)
- “ADE 2025 drew 600,000 visitors across 1,200+ events.” (amsterdam-dance-event.nl)
Sources
These are the exact source pages used for the statistics above:
- CBS Netherlands (Statistics Netherlands)
- Tourist spending €111.2B in 2024 (Centraal Bureau voor de Statistiek)
- Onderzoek & Statistiek Amsterdam (O&S)
- Visitor forecast 2025–2027 (overnight stays) (Onderzoek Amsterdam)
- Gemeente Amsterdam (official reports)
- Nachtvisie Amsterdam 2021 (night culture figures) (Amsterdam.nl)
- Najaarsnota 2025 (Safety + Cleaning program budgets) (Amsterdam.nl)
- Atlas Research (commissioned research for Amsterdam)
- De Waarde van de Kleine Uurtjes (methods + €1.25B estimate + 541 venues) (Atlas Research)
- OECD
- OECD Tourism Trends and Policies 2024 (OECD)
- Amsterdam Dance Event (ADE)
- ADE 2025 press release + overview (amsterdam-dance-event.nl)
- Interviews with licensed tour guides (2025)
- Primary notes (available on request; not a public dataset).
Make it easy to cite
Use these “standalone” lines in articles and reports:
- €1.25B — Atlas Research estimates visitors who come for “fun and going out” spend €1.25 billion during their Amsterdam stay. (Atlas Research)
- 541 venues / 5,000+ jobs — Amsterdam’s Nachtvisie cites 541 night locations supporting over 5,000 jobs. (Amsterdam.nl)
- €328.6M (Safety) — Amsterdam’s 2025 financial note lists €328.6M in expenses for the city Safety program. (Amsterdam.nl)
- €273.7M (Cleaning) — the same document lists €273.7M for “Waste & cleaning public space.” (Amsterdam.nl)
- 600,000 (ADE) — ADE reports 600,000 visitors in 2025 across 1,200+ events op 300+ locations. (amsterdam-dance-event.nl)
“Chart Pack” download (simple bar charts, no clutter)
Create a downloadable ZIP with 4 PNG bar charts (each chart uses one source above):
- Night culture scale: 541 venues en 5,000+ jobs (Atlas Research)
- Visitor pressure: overnight stay forecast 2025 (low–high) (Onderzoek Amsterdam)
- City response: Program 8 Safety expenses (2025) (Amsterdam.nl)
- City response: Cleaning expenses (2025) (Amsterdam.nl)
Key Nightlife Economy Statistics (2026 Snapshot)
These are the most cited statistics about the nightlife economy in Amsterdam for 2026:
- €2.05 billion – Festival and club-related visitor spending in Amsterdam, according to the World Cities Culture Forum.
- 23.0–24.6 million – forecasted tourist overnight stays in Amsterdam for 2025, based on city tourism projections. Source: Onderzoek & Statistiek Amsterdam, 2025
- 600,000 – visitors attended Amsterdam Dance Event (ADE) 2025, with 11,000 music professionals, across 1,200+ events op 300+ locations. Source: Amsterdam Dance Event, 2025.
- Wallen contributes an estimated 21% of all Amsterdam nightlife revenue.
- City spending on policing, sanitation, and public order in nightlife zones: €68.4 million annually (Gemeente Amsterdam, 2025).
Source: Amsterdam Tourism Board Survey, 2025. Data compiled by AmsterdamRedLightDistrictTour.com.
Hospitality Jobs & Business Counts
Nightlife supports tens of thousands of jobs in Amsterdam. These include bartenders, bouncers, DJs, hotel staff, food delivery workers, and more.
Volgens Statistics Netherlands (CBS), tourism-related jobs in the Netherlands reached approximately 771,000 op 2024. This figure includes roles in bars, restaurants, transport, entertainment, and other visitor economy sectors that are essential to Amsterdam’s nightlife ecosystem.
🔗 Source – CBS: Tourism; key indicators (2024)


-
- Coffeeshops
- Restaurants
- Sex Clubs
- Museums
- Canal Cruises
- Bike Rental
Entertainment
-
Contact
© 2010–2026 Amsterdam Red Light District – Amsterdam Red Light District Travel Guide. Webdesign by BIRO.